With so many ways to trade Forex, sticking to the best and most efficient methods will not only saves you time but also your money and effort. One such efficient method to trade Forex is to use Forex Charts patterns.
Commonly, a trader develops a complete trading strategy using patterns that occur frequently and are easy to recognize with little effort.
These forex patterns aid traders in determining the best time to trade. While some of these patterns are sophisticated, most of them are straightforward.
If you’re still unsure about Forex Charts Patterns, continue reading this article till the end to understand the topic more precisely.
What Are Forex Charts Patterns?
The forex charts patterns refer to a collection of past patterns of price behavior for a particular currency pair. Therefore, forex traders must first master the concept of price charts in order to understand forex chart patterns.
Price charts are used by analysts, individual traders, and forex market experts to track historical price movements in a currency exchange rate.
These charts allow traders to basically look into the past. According to technical experts, this previous price behavior might indicate in which direction the asset will move.
Currency price charts display historical activity across many different time frames and quantify the movement of the two forex pairs.
What Are The Most Common Types of Forex Charts Patterns?
The Forex Charts Patterns are broadly divided into three categories: Continuation Chart Patterns, Reversal Chart Patterns, and Bilateral Chart Patterns.
So, let’s discuss each of them in brief!
Reversal Chart Patterns:
A reversal chart pattern indicates that a trend is poised to shift direction. The head and shoulders pattern, rising wedge pattern, reverse Head and shoulders pattern, falling wedge pattern, double bottom pattern, and the double top pattern are all examples of these reversal chart patterns.
Continuation Chart Patterns:
The continuation chart patterns indicate that the ongoing trend will start again. Wedges can be classified as reversal or continuation patterns based on the trend they occur on.
Bull flag patterns, Bearish flag patterns, Bullish Pennants, Bearish Pennants, Falling wedge patterns, and Rising wedge patterns are examples of continuation patterns.
Bilateral Chart Patterns:
Bilateral chart patterns are more complicated patterns as they indicate that the price might move in either direction.
The symmetrical triangles, descending triangles, and ascending triangles are all examples of Bilateral chart patterns.
Top 10 Forex Charts Patterns Every Trader Should Know:
Forex chart patterns play a vital role in technical analysis, but these patterns need practice so that they work more efficiently.
Today, there are numerous Forex Charts Patterns available for traders; some are pretty complex, while others are simple and easily understandable.
Here, we will discuss the top 10 most common forex chart patterns:
Head and Shoulders Patterns:
A Head and shoulders chart pattern features a huge peak on one side and a smaller peak on the other. Traders use the Head and shoulders to indicate a bullish-to-bearish reversal.
The first and third peaks are usually shorter than the second, but they all return to the same degree of support, called ‘neckline.’
The third high will likely break down into a negative downtrend after it has dropped back to support.
Triangle Pattern:
There are many various types of triangle chart patterns available today, but they all follow the same premise.
Triangle patterns belong to the group of continuation chart patterns in mainstream technical analysis. For instance, a symmetrical triangle is a type of neutral chart pattern.
These patterns indicate that the trend that existed before the appearance of the triangle can continue once the pattern is completed.
When trading a triangle pattern, it signals to buy when the price has broken through the pattern’s resistance line and has reached and exceeded the local highs set before the resistance line breakout.
When the price moves a distance less than or equal to the breadth of the first pattern wave, the target profit should be taken (profit zone buy).
Candlestick Patterns:
Forex candlestick patterns are considered one of the best Forex Charts Patterns that most experienced forex traders use to find trading opportunities. This is based on pricing patterns and historical data.
However, Forex candlestick patterns, when combined with other kinds of fundamental and technical analysis, may provide important insight into potential trend reversals, breakouts, and continuations in the forex market.
These patterns are particularly popular for Forex trading. This is because they estimate future price changes based on historical pricing activity.
Double Top:
Another pattern that traders use to get insight into trend reversals is the double top. This is because the price of an asset will usually reach a high point before retreating to a level of support.
On the other hand, it will then surge higher before turning back against the current trend more permanently.
Double Bottom
A double bottom chart pattern suggests a period of selling, with the price of an asset dropping below a support level.
Then it will rise to the point of resistance before descending. Finally, when the market grows more bullish, the trend will invert and continue to go upward.
Additionally, it is a bullish reversal pattern, which indicates the conclusion of a downtrend and the beginning of an upswing.
Rounding Bottom:
A reversal or continuation might be indicated by a rounded bottom chart pattern. For instance, an asset’s price may decline somewhat before rising again during an upswing. This would be a continuation bullish pattern.
It helps traders to profit by purchasing halfway around the bottom, at the low point, and profiting from the continuation after it breaks over a resistance level.
Cup and Handle Pattern:
The cup and handle, a bullish continuation pattern, depicts a period of bearish market sentiment before the forex market trend returns to positive territory.
On the other hand, the cup resembles a rounding bottom chart design, while the handle resembles a wedge pattern.
Wedges Chart Patterns:
When the price fluctuations of a currency pair constrict between two sloping trend lines, Wedges patterns occur. The two forms of wedges are rising and falling.
A rising wedge is a trend line that is trapped between two upwardly sloping lines of support and resistance levels.
Between two downwardly sloping levels, there is a falling wedge. The resistance line is narrower than the support line in this type.
Rectangle Chart Pattern:
A rectangle chart pattern occurs when the price is bordered by parallel support and resistance levels.
A rectangle represents a moment of consolidation or hesitation between buyers and sellers. Before breaking out, the price will “track” the support and resistance levels multiple times.
The price may then move in the direction of the breakout, whether to the upside or to the downside.
Pennant or Flag Pattern:
After an asset has had a period of upward movement followed by a time of consolidation, pennant patterns, or flags, are formed.
During the early phases of a trend, there will usually be a big increase before it breaks down into smaller upward and downward movements.
While a pennant may resemble a wedge or a triangle, it’s vital to remember that wedges are narrower than pennants or triangles.
Also, unlike pennants, wedges are constantly ascending or descending, whereas pennants are always horizontal.
How to Read Forex Charts Patterns?
As mentioned above, Forex charts may assist traders in recognizing previous trends, determining the number of participants in a market, and identifying regions of support and resistance.
One of the most significant components of reading forex charts is deciding on a timeframe. So, let’s discuss how to read different forex chart patterns:
Line Chart Patterns:
As they are the easiest Forex Charts Patterns to read, line chart patterns are one of the most convenient chart patterns to start for beginning traders. However, they provide less information than some of the other chart patterns.
A line chart is just a line drawn between two closing prices. Nevertheless, it can provide traders with a general sense of how a currency pair has performed over time.
Bar Charts:
These chart patterns give traders more information than line charts. Along with closing prices, it shows high and low indications of opening prices.
The lowest segment of the vertical line inside each bar reflects the lowest traded price for the selected currency pair within a certain timeframe.
Similarly, the line’s highest point represents the highest traded price throughout the same span. Two shorter horizontal lines meet each of the vertical lines.
The one on the left shows the opening price for the selected currency pair at a certain time, while the one on the right shows the closing price for the currency pair at that time.
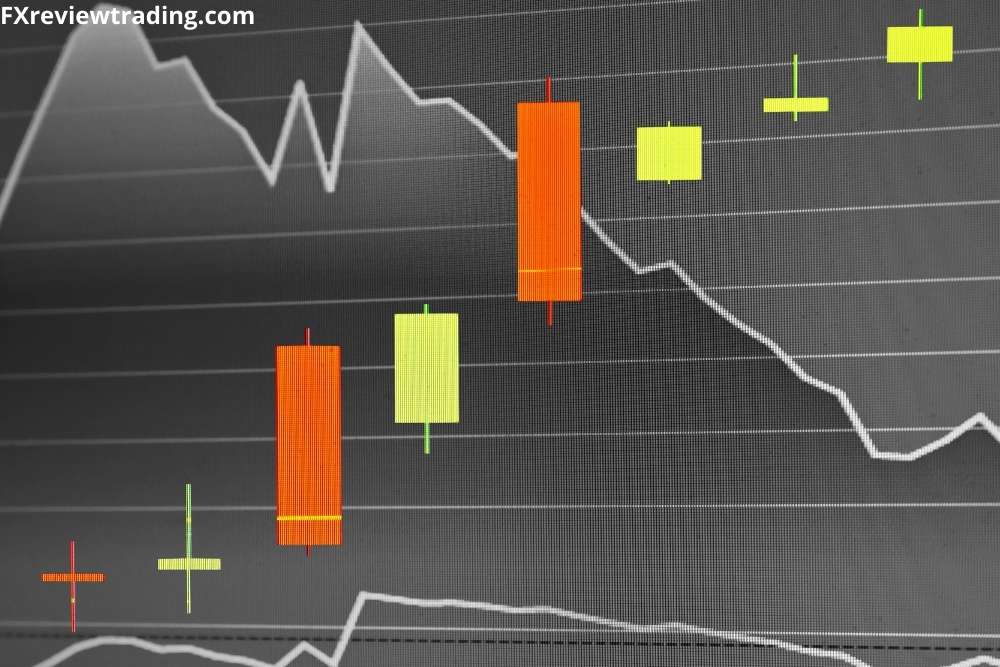
Candlestick Chart Patterns:
This chart pattern is considered the most important and useful of the three main types of chart patterns.
Before reading this chart pattern, it is important to learn about basic candle structure. Each candlestick shows a timeframe – It can be anything from one minute to a few weeks.
The Bottom Line:
All above-mentioned Forex Charts Patterns are important technical indicators that may help you understand in which direction the price of a forex pair will move in the future.
These trading chart patterns may identify regions of support and resistance, which can aid a trader in determining when to open a long or short position.
Additionally, it also helps them in determining when to close out open positions in the case of a trend reversal.
One important thing to keep in mind while using Forex Charts Patterns is that they require a lot of practice.
So, we recommend you to practice using these charts on a demo account first. So, open your free demo trading account with ABInvesting, InvestFW, and capitalix today.
FAQs:
Do Chart Patterns Work in Forex?
Yes, chart patterns work efficiently in forex trading if used correctly. However, it needs a lot of practice before using chart patterns.
How Many Chart Patterns Are There?
There are over 42 chart patterns to choose from. These are further classified into simple and complicated patterns.
What Is The Best Forex Pattern?
Candlestick charts are considered the most efficient and best forex chart patterns.
What Is A Bearish Flag?
The bearish flag, a candlestick chart pattern, indicates that the downturn will continue when the momentary pause is over.
The bear flag, as a continuation chart pattern, aids sellers in pushing the price action to move downward.
How Many Forex Charts Patterns Are There?
There are two common patterns that occur regularly. These are Head and Shoulders and the Triangles.


