When traders and technical analysts are watching the market, they are continuously looking for trends and patterns in the hopes of discovering the best trading opportunity by setting risk levels.
Successful trading requires the ability to recognize and accurately identify patterns, as well as a comprehension of their importance. Because of its long history of trustworthiness among market experts, the head and shoulders pattern is considered one of the most efficient trading tools.
Continue reading this article till the end to understand the importance of this pattern and how it can help many traders in setting profit targets. So, let’s move forward now!
What Is Head and Shoulders Pattern?
The Head and shoulders pattern, a type of trend reversal pattern, is a negative reversal formation on the candlestick chart pattern that can spot a trend reversal after it has concluded.
On the technical analysis chart, the Head and shoulders formation occurs when a market trend is in the process of reversal either from a bullish or bearish trend.
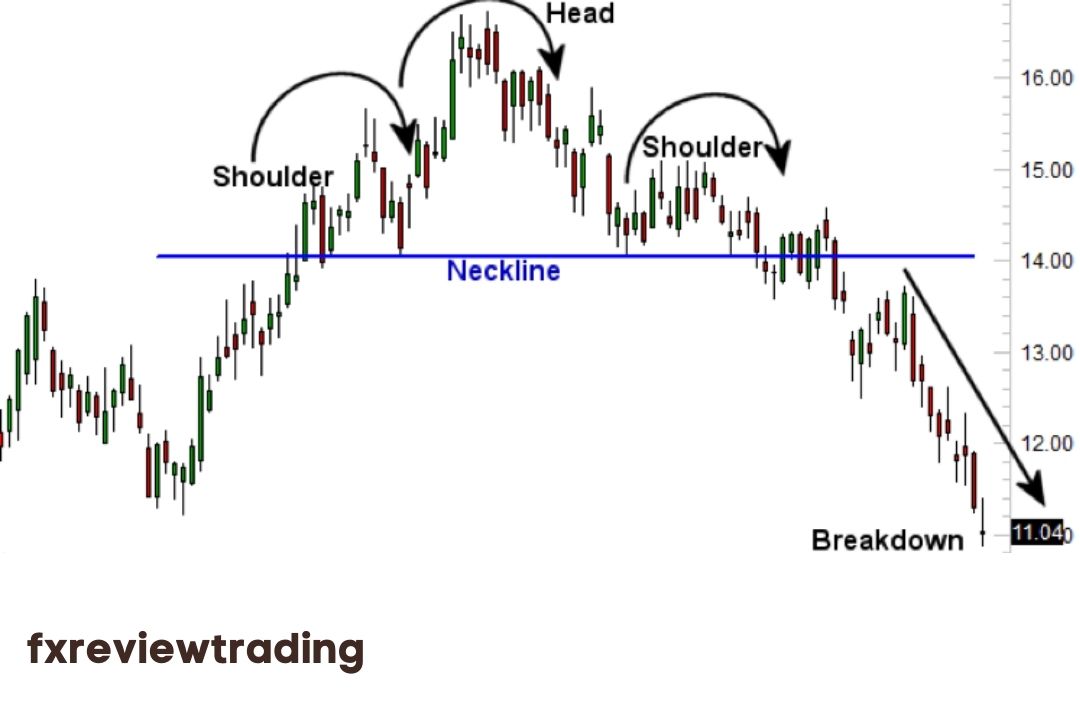
They commonly appear in the shape of a baseline with three peaks on a graph, with the middle peak being the highest. This pattern usually occurs near the end of an upswing and indicates that it will reverse.
Ideally, a pattern consists of a new high, a reversion, and a rebound to make the new high price higher, and that bounces again to form a lower high point before dropping again that is reversion. The neckline, also known as the support trend line, is established by connecting the two lows of the bounce points.
The initial shoulder and head are the first high and the following higher peak. The second shoulder (lower peak) is the peak of the second bounce. The pattern is triggered when the price falls through the support trend line.
When the support trend line is broken, a new downtrend starts, and this pattern forms when the buyers are exhausted and lose interest. On the other hand, combining it with a technical analysis indicator, mainly an oscillator that shows the overbought level makes the pattern even more meaningful.
How To Identify Head And Shoulders Patterns?
The identification of this pattern on forex and stock charts is crucial, which makes it a flexible tool to include in any trading strategy. To find the distance of the subsequent move, measure the vertical distance from the peak of the head to the neckline.
On the other hand, this pattern is considered a big reversal pattern after it has fully formed. The pattern is made up of five components and they must be present in order to validate the formation of the pattern.
Left Shoulder:
After encountering some resistance, the uptrend forms a high and then pulls back for a period. Then, it bounces back to the likely continuing upswing after finding some support.
So, while we can’t see it in real-time, this is how the left shoulder gets produced. For example, the price action could appear to be building a double top.
Prior Trend:
The first thing to analyze is the previous trend, which should be bullish in most cases. The longer an upswing lasts, the greater the chance of a significant reversal that bears can profit from.
Unfortunately, the upswing that led to the head and shoulders pattern is beginning to show indications of weakness, as the bulls are unable to maintain it.
Neckline:
We’ve already defined the neckline, but now is the time to use it to distinguish bulls from bears. To put it another way, if the price breaks below this support level, we can open a short trade with great conviction.
Right Shoulder:
The right shoulder forms when the price finds firm support in the neckline zone on the second pullback and then has one last chance to extend the rise. However, bulls give up after encountering a resistance level at the same level as the first high, and the price retreats for the third time.
In fact, this lengthy process indicates that the bullish trend has reached its limit. The third high represents the right shoulder. The left and right shoulders should preferably be at about the same level, but the pattern will still be useful even if they aren’t.
Head:
The price breaks the previous high during the rebound after the left shoulder formation but runs into a fresh obstacle. Bulls can’t make it despite the momentary surge, and the price is coming back for a second time, leaving the higher high behind. The top of the head and shoulders pattern is generated at this point.
On the other hand, the second pullback comes to a close to the same level as the first support, here is where the neckline begins to develop. We have the left shoulder and the pattern’s head at this time.
How To Trade Head and Shoulders Pattern?
When you’ve identified the pattern, start hunting for a more reliable signal by joining the market.
It’s quite straightforward to utilize a technical analysis pattern while trading forex once a trader understands how to spot the inverse and standard head and shoulders patterns.
As a partially developed pattern may not complete in the future, it is critical for new traders to wait for it to finish. Patterns that are partially or almost finished should be monitored, but no trades should be made until the pattern has broken the neckline.
As a general rule, wait for price action to move lower low than the neckline following the peak of the right shoulder in the head and shoulders patterns. Wait for price movement over the neckline once the right shoulder is established when using the inverse pattern.
When the pattern is complete, a trade can be started. Prepare for the trade by writing down the entry, stop-loss, and profit goals, as well as any variables that may affect your stop or profit target.
To calculate the price target, you should measure the distance between the neckline and the lowest points and then add the result to the breakout price to get the price target you aim for.
What Does A Head And Shoulders Pattern Tell Traders?
The three important component parts of a head and shoulder pattern are as follows:
- The price rises to a high after sustained bullish trends and then the price declines to create a trough.
- Before falling, the price increases again, forming a second high that is far higher than the previous peak.
- The price moves upward trend a third time, but only to the first peak’s level before falling again.
The shoulders are formed by the first and third peaks, whereas the head is formed by the second peak. The neckline is the line that connects the first and second troughs.
How Accurate Is The Head And Shoulders Pattern?
Although head and shoulders are one of the most reliable chart patterns for trading stocks, they can fail just like any other price chart pattern. When we obtain our confirmation signal, the price does not always meet our minimal aim.
Even if the head and shoulders chart pattern proceeds as planned, with a decisive breakthrough in the neckline, it may later ‘fail,’ that is, not complete the trend change.
The first symptom of this is if the price goes back over the neckline – this should not happen once the neckline break, and it indicates that the trend reversals are not as strong as it appears to be. Occasionally, the original pattern will reappear.
Typically, the best method to deal with them is to close the transaction as soon as you realize it isn’t working out. Then, you will be able to spot the indications and, if necessary, reduce your losses swiftly with what you are learning.
What Is Inverse Head and Shoulders Pattern?
When a downtrend turns into an upswing, the inverse head and shoulders pattern emerges. It is also known as a reverse head and shoulders or head and shoulders bottom.
As a result, it’s only a gradual shift in the trend’s direction, as seen by a broken trendline and a weakening of the current trend. Trading volume is crucial in validating the pattern as an efficient inverse head and shoulders.
While volume is less relevant during negative price changes, it is critical when a strong trend is heading up. When the neckline price breaks, the volume should expand as it rises from the head and may be much stronger.
The last bull rise must also show strong volume strength to validate the power of the price’s new direction.
Volume is more crucial with this reliable pattern than with the head and shoulders topping pattern. When the price is falling, you don’t have to be concerned about volume because the price can fail without any market action due to a lack of interest or demand.
On the other hand, when prices climb, the volume must be high for the price to rise, indicating that buyers are pushing the price up. In other words, it’s a genuine and well-supported initiative.
What Is Complex Head and Shoulders Pattern?
Of course, nothing is simple in life, especially in trading, and you will not always get a perfect copybook head and shoulders pattern. The ‘Complex Head and Shoulders Pattern,’ a more intricate variant with added pieces, is one variation you can locate.
The extra details include a double head or a double shoulder – in other words, the tendency is to take longer to change opposite direction.
This pattern has the same forecasting abilities as the standard pattern, and you can figure out why by applying the same ideas. Unfortunately, this isn’t one of the things that happen very often.
Bottom Line:
As mentioned earlier, the head and shoulders pattern is one of the best, most popular, and most efficient patterns. However, still, there are chances of failure of the pattern, so you should be ready for it, especially when you’re trading highly volatile assets such as cryptocurrencies.
While the pattern might be subjective at times, it includes entries, stops, and profit target, making it simple to adopt a trading strategy. A left shoulder, head, and right shoulder make up the pattern.
If you’re searching for a trading platform to use head and shoulders patterns, then there is no better place to start than Investby. But before starting, ensure that you are fully aware of the risks involved and, if necessary, seek independent financial advice for better future results.

