Trading in the market requires various analyses to be in the race of traders. For this, traders use fundamental analysis and economic data or use the technical analysis to get into the details of price movements. This helps traders have a forecast of the market and decide on the investments. However, most of the traders prefer using the technical analysis tools such as the trading indicators to trade.
Trading indicators visually represent the mathematical calculations and data movements, using the trade history, price changes or volume of the trade. These tools have a significant impact on the financial market.
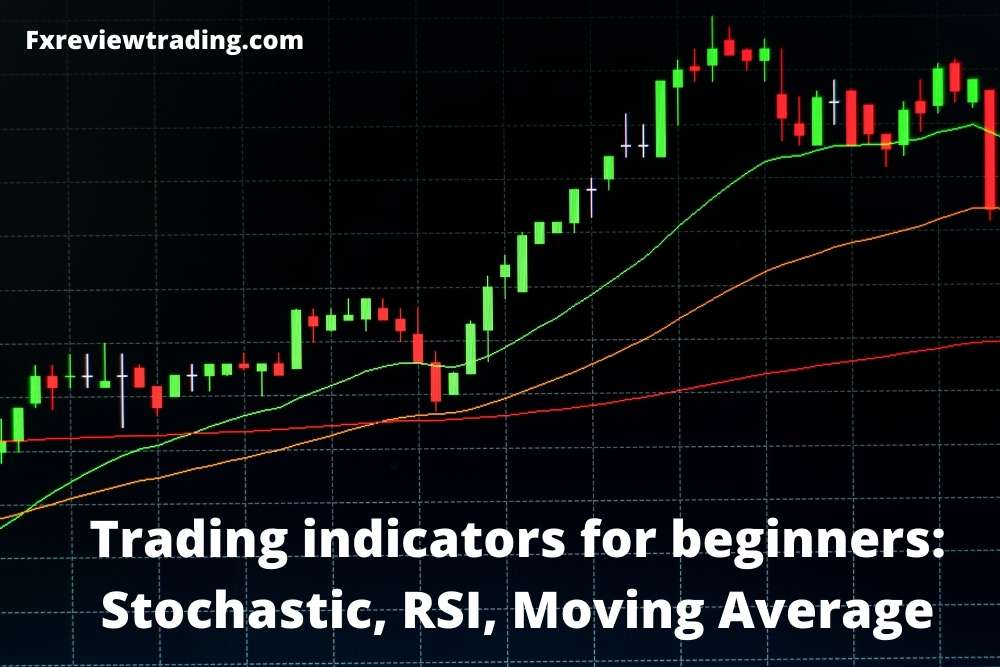
The article focuses on the three important trading indicators and their use: Stochastic, RSI, and Moving Average.
Trading Indicators
Traders use the past data and technical analysis to get a better market view, for which they use the trading indicators. As these help them predict the market fluctuations and price movements, these have become vital tools for the trade. In addition, investors put in their funds in various instruments of the markets, and they make strategies according to the instrument. Thus, having different time frames and data for the instruments.
There are enormous types of data available daily in the financial markets, but which one suits the instrument depends on the time frame the trader wants to use. Trading indicators simplify the trade and are highly fascinating for beginners of the trade. These are presented visually; thus, the patterns are easy to read and understand, helping traders to recognise the price change with ease.
Trading indicators analyse the market for the future and can be used for getting past trade history and the trade volume. It could be used for many markets such as the forex, commodities, indices, metals and cryptocurrency etc. Traders use them with different time frames and are most popular with the swing traders and the day traders. However, all the market traders can use them for the long and short market positions.
Benefits of Trading Indicators
Trading indicators are beneficial for the traders of markets; they can enjoy the following advantages:
- Easy visual representation
- Help traders confirm the trade direction
- Help traders set the stop-loss and take profit orders
- Gets information about price momentum
- Studies the market changes
- Know about market entry and exit
- Forecast the future
- Trade confidently
- Number of trade indicators
Drawbacks of Trading Indicators
With so many advantages trading indicators have some drawbacks, here we have listed them down:
- Lagging
- Could be messy sometimes
- The analysis could be wrong
- Market volatility affects the decisions
Trading Indicators for Beginners
The beginners of the market are new to the financial markets and have less experience to judge the fluctuations. To help them with the market and smooth trade, there are several trading indicators. They can use the following indicators to forecast:
- Bollinger Bands
- Moving Average
- Relative Strength Index
- Oscillators
- Stochastic
- Average Directional Index
- Fibonacci retracement
- Ichimoku cloud
- Standard deviation
However, traders can use many more which are not mentioned in the list. As the list is long, traders can use them independently or together for more confident trade. Traders in advance plan and make strategies to trade accordingly and use the right trade indicators at times. They can create accounts with online brokers such as ABInvesting, for the services and trading platforms offered. They have trading platforms that have 30+ in-built trading indicators and several tools to analyze the market. The technical and fundamental analysis is advanced with the brokers.
In the article, we have mainly focused on three trading indicators that are suitable for beginners of the trade. In the different heading, the Stochastic, Relative Strength Index, and Moving Average are discussed in detail to better understand them and their use.
Stochastic Trading Indicator
A momentum indicator, Stochastic, is used to identify the closing price of the instrument at present in a set time period. The trading indicator was developed in the 1950s by George Lane. He used it to measure the relationship between the closing price and the range of price at predetermined time frames.
It is a technical indicator that has wide use in the financial markets, with its easy use analysis and high accuracy. Traders using the trade indicator can decide the time when they can buy and sell the instrument for trade. Investors decide on the overbought and oversold conditions of the instrument with a Stochastic trading indicator.
Trades can use Stochastic indicators with an Oscillator such as RSI to get accurate predictions.
Stochastic is a mathematical indicator using a formula to represent the market change. Let’s understand the formula of the Stochastic:
Stochastic uses two factors: a K line and a Dline to measure. However, the Dline has more significance and is closely monitored. The line gives trade signals regarding the market changes.
K line formula
%K = 100 x CP-L14/ H14 – L14
Here, CP = Recent closing price
L10 = Lowest price of previous fourteen trading sessions
H10 = Highest price of the previous fourteen trading sessions
D line formula
D = 100 ( H3/L3)
The charting software available with the brokers makes the process of calculations easy as they directly get traders with the visual representation. Traders can check the charts and analyse them easily to get the movements of the prices. Investors have access to the market with the software at use.
Reading the Stochastic charts:
The Stochastic charts are easy to understand; the two lines K and D are present in the chart. The K line is faster in movement than the D line. Traders closely focus on the D line; the price of the instrument changes, moving into an overbought or oversold situation. The overbought level is when the line is above 80, and in the oversold level, it is below 20.
According to the position of the line, the trader decides upon the market trade. In the overbought situation, the trader sells the instrument in the market whereas, in the oversold condition, traders buy the instruments from the market with increased trade volume.
Stochastic interpretation is that the %K is at 80 means that in the price range of the last 14 days, the instrument price will remain high with a strong uptrend. The D line uses the three periods moving Average of the %k acting as a single line.
When the %k line crosses the D line, it indicates a trading signal for traders to take action according to the market situation.
The trading indicator normally uses 14 days period to calculate, but traders can modify it as per their needs. They can make it 10 or 5, depending on the trading strategy.
Stochastic indicator other use is the divergence; it identifies the bearish and bullish divergence for the traders. Thus, helping traders recognise the reversals of the market. The bullish divergence is when the price makes a lower low and the Stochastic shows a higher low. The situation says that the downside momentum is weak, and there could be a reversal on the upside.
The bullish divergence is confirmed in the analysis when the price action is bullish with the Stochastic indicator in the uptrend.
Conversely, the bearish divergence is formed when the price is higher high, and the Stochastic makes a lower high. Suggesting that the upside momentum is limited and with the sign of reversal anytime on the downside. Traders can confirm the bearish divergence when the price becomes bearish, and the Stochastic continues on the downtrend.
With the help of the above points, traders can easily read the Stochastic charts and use them in their market trade. A straightforward indicator that requires market practice and an understanding of chart reading to make use of. It is convenient to use the charts and patterns formed with the article; this gives a brief detail of the trading indicator with how to read and use it.
Relative Strength Index (RSI)
Relative strength index is a technical analysis tool that studies the momentum of the prices. As a momentum indicator, the RSI measures the recent price change to know about the overbought and oversold conditions in the traded instrument. The RSI is represented on the charts; thus, it is an oscillator. An oscillator means a line graph that moves in between the two extremes of the market instrument.
The Relative Strength Index has readings from zero to a hundred and is easy to study for market forecasts. The indicator was developed by J.Welles Wilder Jr., introducing it in his book, “New Concepts in Technical Trading System”, written in 1978.
It uses the traditional method of indication to signal traders when the price of the instrument is above 70; it is an overbought situation. Similarly, when the indicator visualises price below 30, it is termed as an oversold situation.
Traders use it for trend reversal and pullback; traders should be able to understand and read the chart properly for successful investments and high profits.
RSI Formula:
RSI = 100 – { 100/ (1+RS)}
(RS stands for relative strength)
RS = Average gain / Average loss
Calculation of RSI:
The relative strength index uses the average time period of 14 days to calculate the ups and downs of the market. First, traders take the average gain of the days and divide it with the average days of 14 days. After that, traders take the loss days and divide them with 14 days.
When the market closes up, it is assumed that it is a bullish situation, and when it is opposite, that is, the market closes at low, traders assume it as a bearish situation.
The indicator could be used for divergence, overbought and oversold and market entry and exit. They study the 0 to 100 index and decide over the investments.
Traders buy when the RSI signals an oversold situation, price is below 30 whereas, in the overbought situation where the price lies above 80, traders sell the instrument.
However, traders should be clear that the RSI works best when the market is not trending. It is due to the reason that when the market is trending, it stays for a long period in the overbought and oversold situations of the market. Thus, the correction of the market takes time.
To handle such situations, traders can use other trading indicators to be precise and confident about the trade decisions.
Moving Average
Another significant trading indicator is the Moving Average, which analyses the market and helps traders determine the market trend. As the name says, it is a moving average because the price data are regularly monitored for correct decisions. It is used by the market traders to examine the support and resistance level by studying the price of the instrument.
Moving averages sum up the data of the instrument traded in a particular time frame and divide it by the number of data points to get an average of the data. Then, the market analysts use it to get the previous price changes in the market. Thus, determining the price direction in the future.
The moving Average is also termed as the lagging indicator of the market. It analyses the price of the instruments and gives the trade direction for successful investments.
There are types of moving averages that are used in the market; all have their significant use.
- Simple Moving Average
- Exponential Moving Average
Simple Moving Average
It is the simplest form of moving averages, where the arithmetic means is taken of the instrument with a set time period and value. Here, we have the formula of simple moving averages for understanding it:
SMA = A1+A2+………An/ n
It takes all the data and divides it by the number of data to get the simple moving Average of the instrument. Thus, the financial instruments values are added together and divided by the number of prices taken.
Here, A = the average period of n
n = Number of time periods
Exponential Moving Averages
The exponential moving average is contrasting from the simple moving Average with weightage to the recent price data. Thus, the moving average is more responsive to the recent information on the trade. The formula used for calculating the exponential moving average is:
EMAt = [ Vt x (S/ 1+d) ] + EMAy x (1- {S/1+d})
Here, EMAt = EMA today
Vt = Value today
EMAy = EMA yesterday
S = Smoothing
d = Number of days
Conclusion
The trading indicators have significance in the financial markets, as traders cannot analyse the market without the use of technical and fundamental tools. Using the price data, they provide traders with the price movements, which is beneficial for future trade decisions. The fundamental tools relate to the economic and social data and news of the world, which also has an impact on trade.
Thus, both technical and fundamental analysis have their essential use in the financial markets. So, traders should use these to have correct predictions of the trade and maximise profits.
However, traders should be aware that these are not always exact and use the indicators together for confident decisions and good market analysis.